
Registration for NGSchool 2023: Advances in Computational Biology is now closed. Thank you to all who took the time to answer the questions and solve the problems in the registration form. Here we publish the solutions.
Correct answers are marked in bold.
Bioinformatics
The first set of questions checked that the applicants understand the basics of biological study design, can critically interpret presented results and successfully utilize publicly available resources.
B1
Proton radiotherapy is an advanced method of treating certain cancers. Which of the following data sets from Gene Expression Omnibus (GEO) could be used to check how this type of irradiation affects human cells and tissues?
A) GSE67243
B) GSE192899
C) GSE169522
D) GSE145577
E) GSE162986
B2
The figure shown below comes from the paper on changes induced in testes by Zika virus. Which of the following statements correctly describe this figure?
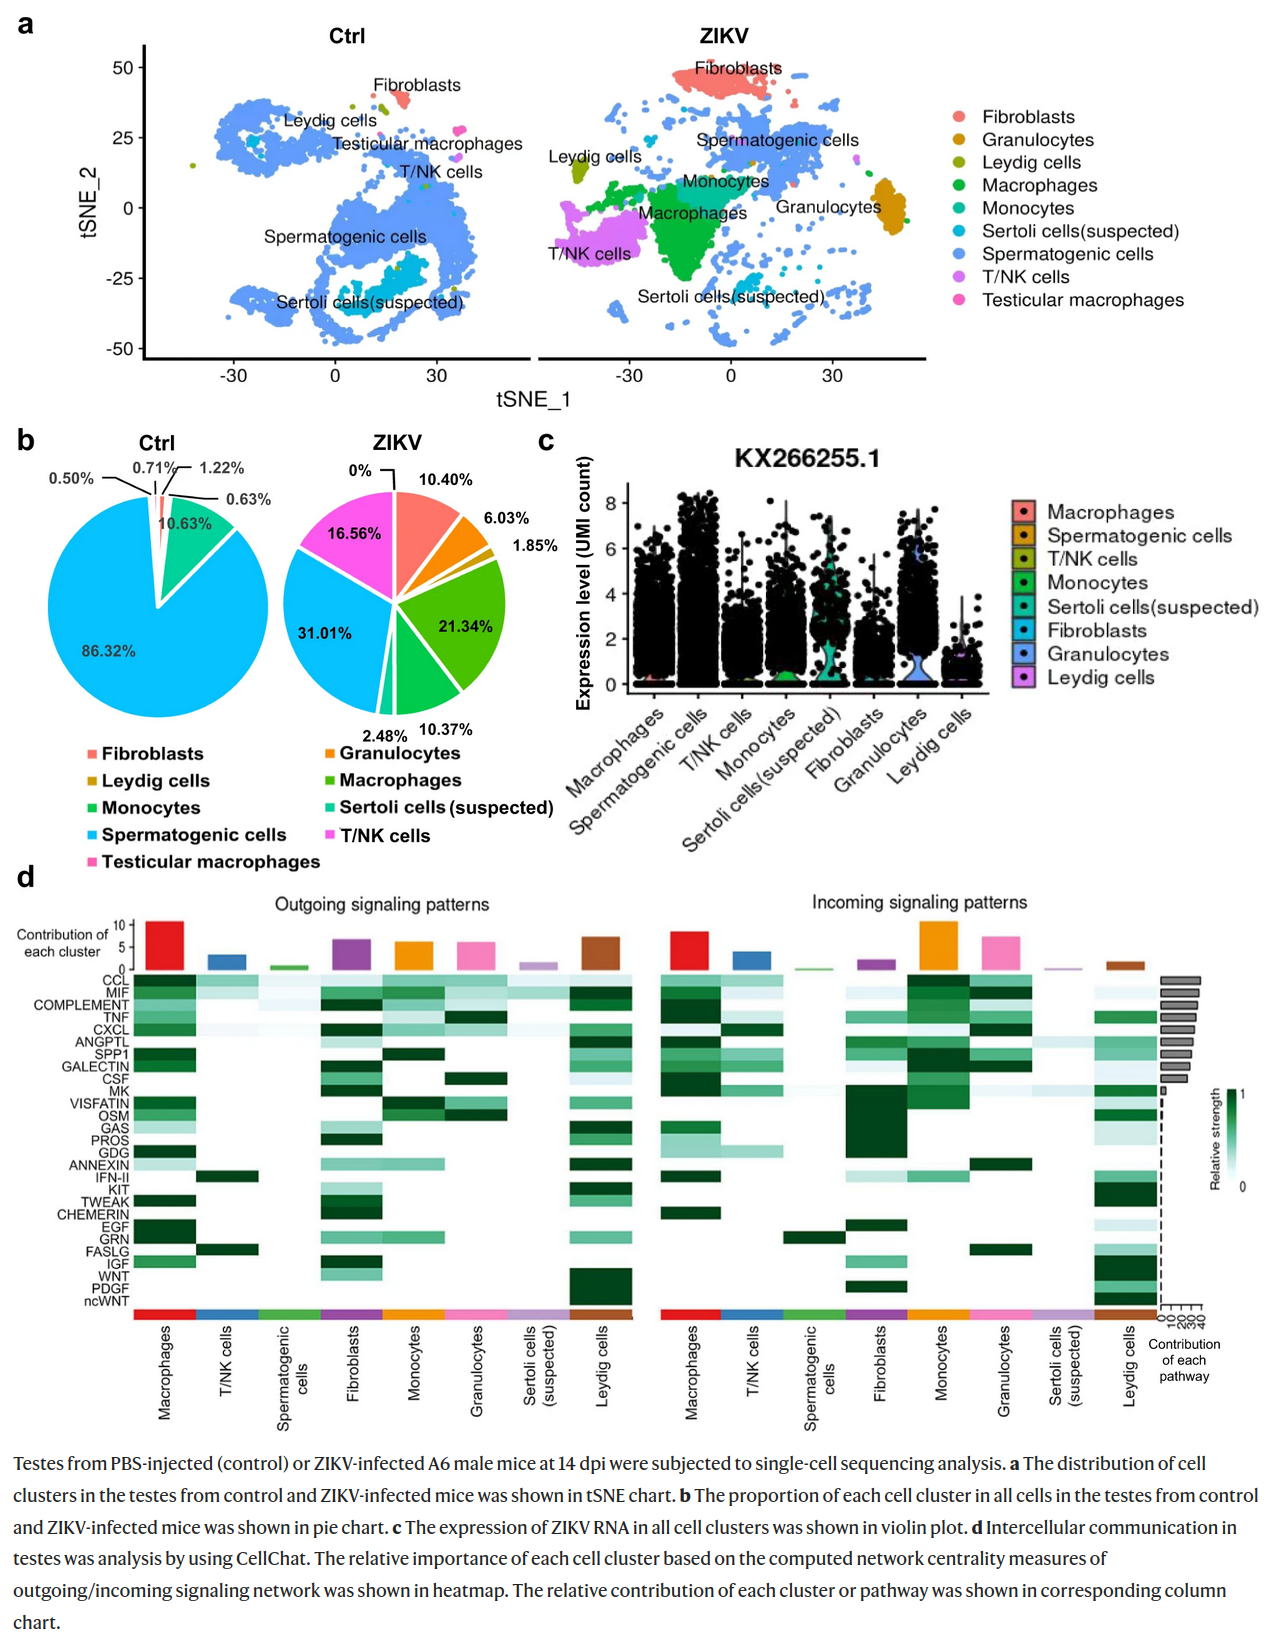
A) Granulocytes and monocytes were much more abundant in Zika-infected testes than in control.
B) Zika RNA was not detected in spermatogenic cells of infected animals.
C) Gene expression profile in granulocytes and T/NK cells is very similar, while monocytes and macrophages are easily distinguished.
D) In infected testes infiltrating white blood cells constitute less than 5% of total cell count, while in infected testes they are more abundant than spermatogenic cells.
E) In the intercellular communication analysis macrophages and monocytes contributed considerably to both outgoing and incoming signalling.
B3
The figure below characterises 5 transcriptomic subtypes (S1, S2, S3, S4, S5) of bladder cancer identified in the paper from Nat. Comm.. Which of the following descriptions of mutation profiles of different subtypes are correct?
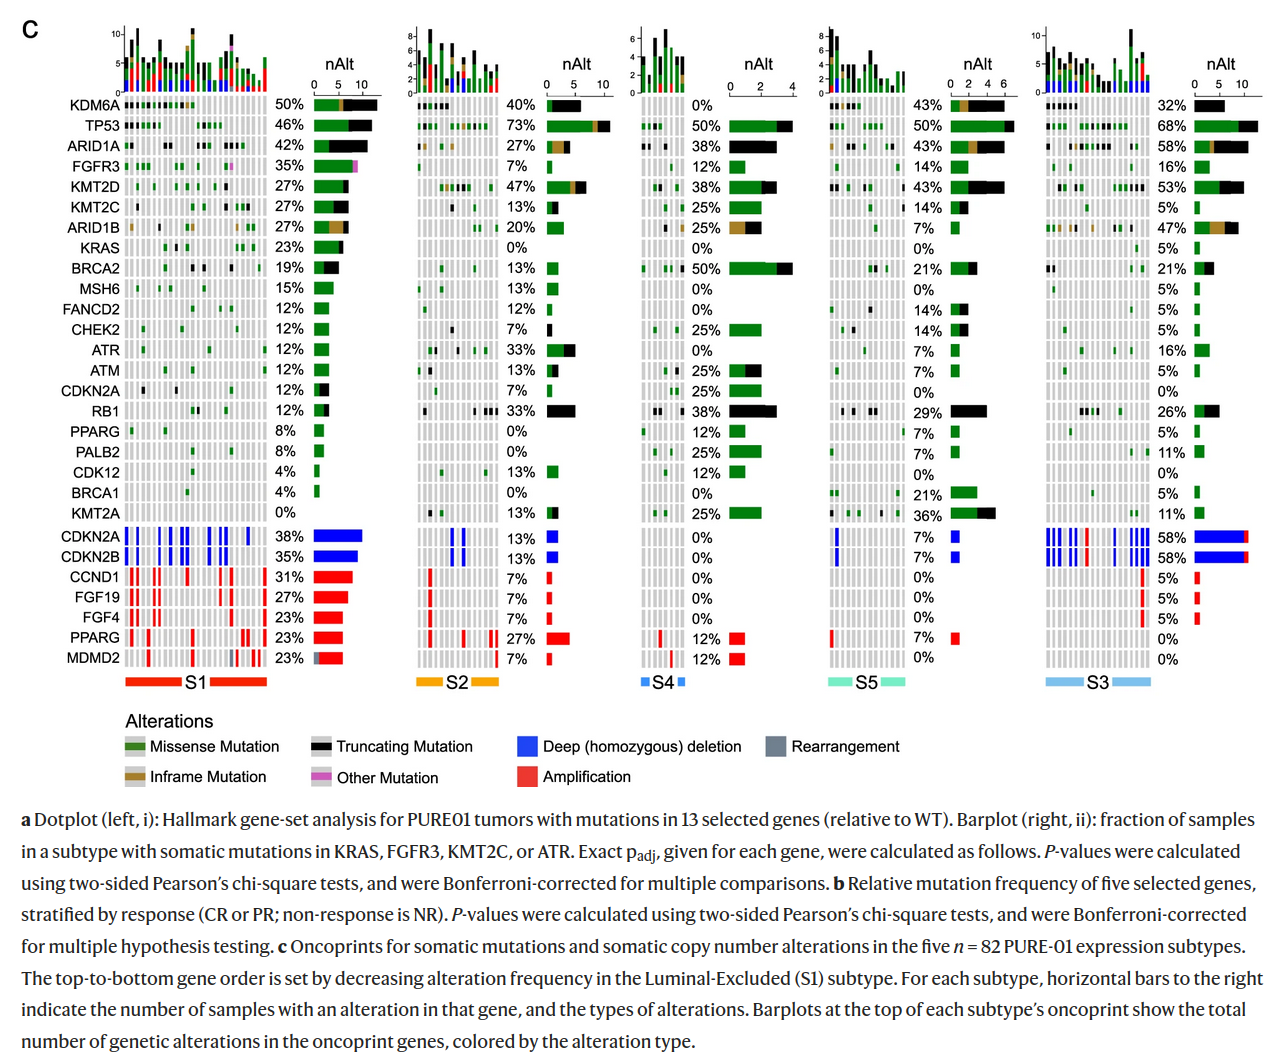
A) In all subtypes more at least 50% of cancer samples have mutations in TP53.
B) Three subtypes do not harbour KRAS mutations.
C) Amplifications of CDKN2A are more frequent than deletions.
D) No truncating mutations were observed in FGFR3 and PALB2.
E) Frequency of amplification is the greatest in S2 and the lowest in S4.
B4
This figure fragment is from the article describing surface CD19 expression in B-cell Acute lymphoblastic leukemia before- (T1) and after (T2) treatment with anti-CD19 CAR-T therapy. Using this figure, we can conclude that:
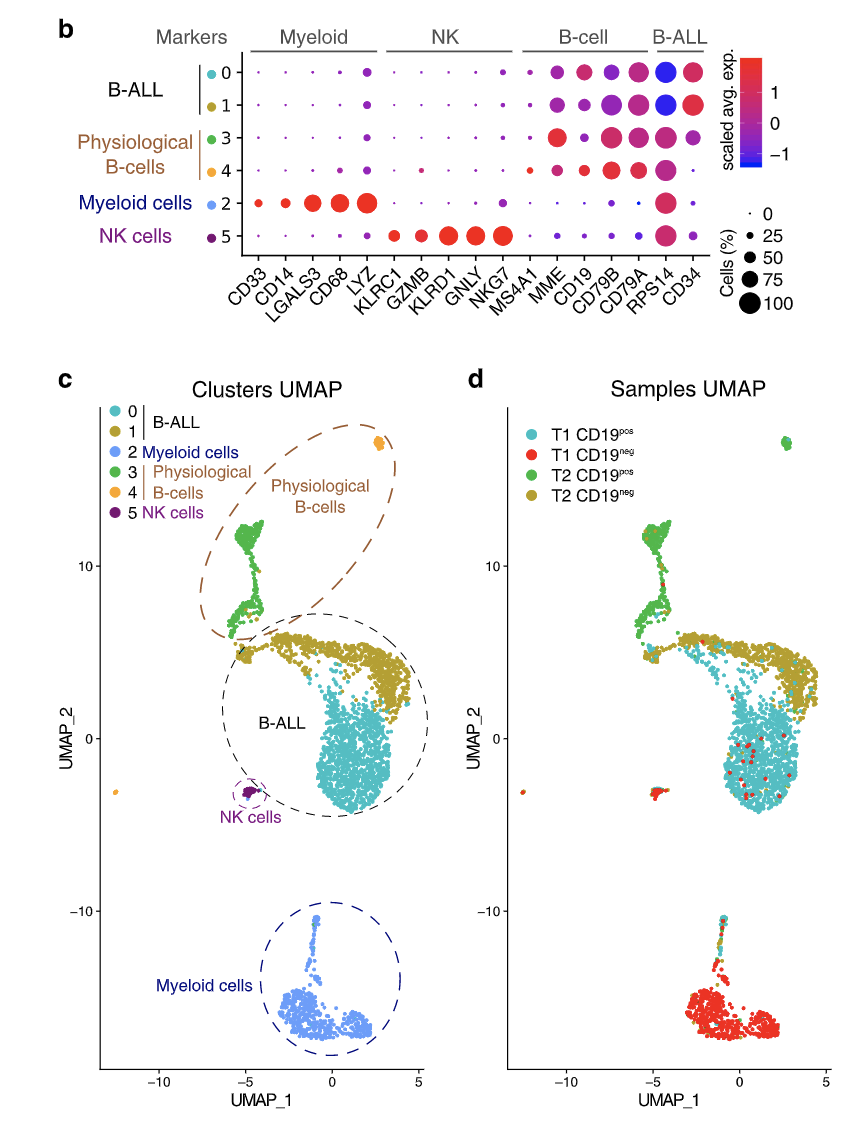
A) NK cells are transcriptomically more similar to B-ALL cells than Myeloid cells.
B) There were some CD19- (negative) B-ALL cells present before the treatment.
C) CD19- B-ALL cells are transcriptomically similar in both timepoints (T1 and T2).
D) None of the NK cells expressed KLRC1.
E) All myeloid cells were CD19- (negative) at both timepoints.
Statistics and probability
The second set of questions tested the participant’s familiarity with basic concepts in probability and statistics.
S1
A particular dominant allele of a gene has a frequency of 0.4 in a population. If the population is in Hardy-Weinberg equilibrium, what are the expected frequencies of the homozygous dominant, heterozygous, and homozygous recessive genotypes?
A) Homozygous dominant: 0.16, heterozygous: 0.48, homozygous recessive: 0.36
B) Homozygous dominant: 0.22, heterozygous: 0.38, homozygous recessive: 0.40
C) Homozygous dominant: 0.20, heterozygous: 0.50, homozygous recessive: 0.30
D) Homozygous dominant: 0.38, heterozygous: 0.42, homozygous recessive: 0.20
E) Homozygous dominant: 0.30, heterozygous: 0.45, homozygous recessive: 0.25
Explanation:
Dominant allele (A) frequency = 0.4
Recessive allele (a) frequency = 1 - 0.4 = 0.6
Homozygous dominant genotype (AA) frequency = 0.4 * 0.4 = 0.16
Homozygous recessive genotype (aa) frequency = 0.6 * 0.6 = 0.36
Heterozygous genotype (Aa) frequency = 1 - (0.16 + 0.36) = 0.48
S2
In a certain population, the frequency of a recessive allele for a genetic disorder is 0.1. What is the probability that 2 pairs of carriers grandparents will have an affected grandchild, assuming that affected people can have children?
A) 25.00%
B) 75.00%
C) 43.75%
D) 68.75%
E) 31.25%
Explanation:
Since both pairs of grandparents are allele carriers (heterozygous - Aa) there are three possibilities that lead to a child being affected by the disease (being homozygous recessive - aa):
- Both parents are heterozygous.
Probability of child being affected given this situation is equal $P_1 = P(parent A = Aa) * P(parent B = Aa) * P(child = aa | parent A = Aa & parent B = Aa)$
To calculate probability of parent being a carrier we will utilize Punnett Square:
| \ | A | a |
| A | AA | Aa |
| a | Aa | aa |
$P(parent A = Aa) = 0.5$
$P(parent B = Aa) = 0.5$
$P(child = aa | parent A = Aa & parent B = Aa) = 0.25$
$P_1 = 0.5 * 0.5 * 0.25 = 0.0625$
- Both parents are homozygous.
Probability of child being affected given this situation is equal $P_2 = P(parent A = aa) * P(parent B = aa) * P(child = aa | parent A = aa & parent B = aa)$
$P(parent A = aa) = 0.25$
$P(parent B = aa) = 0.25$
$P(child = aa | parent A = aa & parent B = aa) = 1$
$P_2 = 0.25 * 0.25 * 1 = 0.0625$
- One parent is heterozygous, one parent is homozygous.
Probability of child being affected given this situation is equal $P_3 = P(parent A = Aa) * P(parent B = aa) * P(child = aa | parent A = Aa & parent B = aa) + P(parent A = aa) * P(parent B = Aa) * P(child = aa | parent A = aa & parent B = Aa)$
Here is a Punnett Square suitable for this situation:
| \ | A | a |
| a | Aa | aa |
| a | Aa | aa |
$P(child = aa | parent A = Aa & parent B = aa) = 0.5$
$P(child = aa | parent A = aa & parent B = Aa) = 0.5$
$P_3= = 0.5 * 0.25 * 0.5 + 0.25 * 0.5 * 0.5 = 0.0625 + 0.0625 = 0.125$
Therefore, the probability of child being affected by the disease given that both pairs of its grandparents are carriers is a sum of probabilities for three above cases $P = P_1 + P_2 + P_3 = 0.0625 + 0625 + 0.125 = 0.25$
S3
A researcher measures the expression levels of 1000 genes in two different cell types, and finds that the expression levels are normally distributed with mean 10 and standard deviation 2 in cell type A, and mean 8 and standard deviation 1.5 in cell type B. What is the probability that a gene has higher expression in randomly selected cell of type A than in randomly selected cell of type B?
A) 0.788
B) 0.211
C) 0.873
D) 0.106
E) 0.894
Explanation:
Let $X$ be the expression level in a randomly selected cell of type A and $Y$ be the expression level in a randomly selected cell of type B. We are interested in finding $P(X > Y)$, given:
$X ~ N(𝜇=10, 𝝈=2^2)$
$Y~ N(𝜇=8, 𝝈=1.5^2)$
When we subtract one normally distributed variable from another, the mean of the resulting distribution is the difference of their means, and the variance is the sum of their variances. Let, $Z=X−Y$. The probability $P(X > Y)$ is equivalent to $P(Z > 0)$.
Mean of Z: $E(Z) = E(X) - E(Y) = 10 - 8 = 2$
Variance of Z: $Var(Z) = Var(X) + Var(Y) = 2^2 + 1.5^1.5 = 6.25$
Standard deviation of Z: $𝝈_Z = \sqrt{6.25} = 2.5$
So, $Z ~ N(2, 2.5^2)$ To find $P(Z > 0)$ by hand we can convert it a standard normal distribution: $Z' = \frac{Z - 2}{2.5} and utilize a Z-table.$ Alternatively, we can approximate the value by simulating a large vector of random values originating from given distribution and check how many are larger then 0. Here is how we can do that in R:
v <- rnorm(n=1000,mean=2, sd=2.5)
sum(v > 0)/1000
# 0.781
Therefore, there's approximately a 78.81% probability that a gene has higher expression in a randomly selected cell of type A than in a randomly selected cell of type B.
S4
A researcher wants to model serum glycated hemoglobin (HbA1c; continuous variable) of patients with type 1 diabetes after 6 months from inclusion to the study as a function of age, sex, body mass index, reported carbohydrate intake and the number of hypoglycemia events during observation period. Which of the following techniques can be used for this task?
A) Logistic regression
B) Analysis of covariance
C) Linear regression
D) Random forest
E) Naive bayes classifier
Explanation:
For logistic regression and naive bayes classifier the dependent variable is binary (0/1), while HbA1c level is continuous. Analysis of covariance is used to compare means of several groups after accounting for the effect of covariates. Both linear regression and random forest could be used for the task.
S5
Expected error of a statistical model consists of three components:
- Bias of statistical method - an error resulting from approximation of complex real-life problem with simplified model.
- Variance of statistical method - error resulting from changes of function approximation when a model is trained with different datasets.
- Irreducible error (variance of error terms).
With increasing complexity/flexibility of a model, assuming we have enough data for training, we expect the following behaviour of error components and errors itself:
A) Squared bias will rise
B) Train error will decline
C) Test error will decline
D) Constant error will decline
E) Squared bias will decline
S6
A researcher found that gene X is differentially expressed between tumour and normal tissue with p-value 0.05 and fold change 2.5 (2.3, 2.7) where values in the brackets represent 95% confidence interval for fold change. It means that:
A) there is 5% probability that true fold change of gene X is higher than 2.7
B) there is 5% probability that gene X would have this or lower fold change if it was not differentially expressed
C) number of cells expressing gene X is 2.5 higher in tumour than in normal tissue
D) there is 95% probability that true value of this fold change is between 2.3 and 2.7
E) the expression of gene X differs significantly between groups and the difference is greater than in 95% of other genes
Coding
The last set of questions tested the basic coding skills of applicants to ensure they will be able to follow the practical part of the Summer School. While the practical part of the NGSchool program will be conducted using mainly Python and R, you could solve the following problems using your language or framework of choice.The coding solutions provided below are in R (and utilise the tidyverse suite of packages).
C1
Below you will find the amino acid sequence of p53 isoform a (each letter represents one amino acid). Which amino acids are the most and the least frequent ones in this sequence and how many times they are present?
MEEPQSDPSVEPPLSQETFSDLWKLLPENNVLSPLPSQAMDDLMLSPDDIEQWFTEDPGPDEAPRMPEAAPPVAPAPAAPTPAAPAPAPSWPLSSSVPSQKTYQGSYGFRLGFLHSGTAKSVTCTYSPALNKMFCQLAKTCPVQLWVDSTPPPGTRVRAMAIYKQSQHMTEVVRRCPHHERCSDSDGLAPPQHLIRVEGNLRVEYLDDRNTFRHSVVVPYEPPEVGSDCTTIHYNYMCNSSCMGGMNRRPILTIITLEDSSGNLLGRNSFEVRVCACPGRDRRTEEENLRKKGEPHHELPPGSTKRALPNNTSSSPQPKKKPLDGEYFTLQIRGRERFEMFRELNEALELKDAQAGKEPGGSRAHSSHLKSKKGQSTSRHKKLMFKTEGPDSDA) The most frequent: 48 proline, the least frequent: 8 isoleucine
B) The most frequent: 26 arginine, the least frequent: 9 tyrosine
C) The most frequent: 45 proline, the least frequent: 4 tryptophan
D) The most frequent: 38 serine, the least frequent: 8 valine
E) The most frequent: 42 serine, the least frequent: 4 valine
aa <- 'MEEPQSDPSVEPPLSQETFSDLWKLLPENNVLSPLPSQAMDDLMLSPDDIEQWFTEDPGPDEAPRMPEAAPPVAPAPAAPTPAAPAPAPSWPLSSSVPSQKTYQGSYGFRLGFLHSGTAKSVTCTYSPALNKMFCQLAKTCPVQLWVDSTPPPGTRVRAMAIYKQSQHMTEVVRRCPHHERCSDSDGLAPPQHLIRVEGNLRVEYLDDRNTFRHSVVVPYEPPEVGSDCTTIHYNYMCNSSCMGGMNRRPILTIITLEDSSGNLLGRNSFEVRVCACPGRDRRTEEENLRKKGEPHHELPPGSTKRALPNNTSSSPQPKKKPLDGEYFTLQIRGRERFEMFRELNEALELKDAQAGKEPGGSRAHSSHLKSKKGQSTSRHKKLMFKTEGPDSD'
aa_vec <- strsplit(aa, '')[[1]]
sort(sapply(unique(aa_vec), function(x){sum(x==aa_vec)}))
Result of above command:
| W | I | Y | C | F | M | H | N | Q | V | D | K | T | G | A | R | E | L | S | P |
|---|---|---|---|---|---|---|---|---|---|---|---|---|---|---|---|---|---|---|---|
| 4 | 8 | 9 | 10 | 11 | 12 | 12 | 14 | 15 | 18 | 20 | 20 | 22 | 23 | 24 | 26 | 30 | 32 | 38 | 45 |
Description for C2, C3 and C4
GDSbrowser dataset contains the table listing all datasets available in Gene Expression Omnibus (GEO) and their basic characteristics, including name of the species, number of samples and platform. Analyse this dataset to answer the following questions.
In the following three questions, we treat each unique name in species or platform column as separate species/subspecies or platform even if some resulted from typos.
Data and packaging loading:
library(tidyverse)
data <- read.csv('~/Downloads/GDSbrowser.csv')
C2
For which of the species GEO has the greatest number of samples and how many?
A) Homo sapiens 1750
B) Rattus norvegicus 7237
C) Mus musculus 1631
D) Mus musculus 23562
E) Homo sapiens 42671
data %>%
	group_by(Organism.s.) %>%
	summarise(n=sum(Samples)) %>%
	arrange(desc(n)) %>%
	head()
# A tibble: 6 × 2
# Organism.s.                  N
# <chr>                    <int>
# 1 Homo sapiens             42671
# 2 Mus musculus             23562
# 3 Rattus norvegicus         7237
# 4 Saccharomyces cerevisiae  1690
# 5 Drosophila melanogaster   1078
# 6 Arabidopsis thaliana       981
C3
How many datasets’ titles refer to cell lines? Estimate it by counting the number of titles containing the phrase “cell line” (if it is a part of a longer phase like “cell lines” you should count it as well, but you should not count alternatives like “cellular line”).
Remember that you should count the phrase if it contains any capital letters, too.
A) 1418
B) 416
C) 417
D) 1424
E) 460
titles <- tolower(data$Title)
sapply(titles, function(x) {grepl('cell line', x)}) %>% sum()
C4
Gene Expression Omnibus contains data:
A) about 94 species/subspecies
B) from 493 different platforms
C) of 82666 samples
D) from Saccharomyces boulardii
E) from Danio rerio
data %>% select(Organism.s.) %>% distinct() %>% nrow()
# 94 unique species/sub-species
data %>% select(Platform) %>% distinct() %>% nrow()
# 439 different platforms
data %>% summarise(sum(Samples))
# 82666 samples
'Saccharomyces boulardii' %in% data$Organism.s.
# no S.boulardii in the database
'Danio rerio' %in% data$Organism.s.
# D.rerio in the database
C5
Take a look at the following function (in either R or python):
library(dplyr)
doStuff <- function(x, nStart=1, nEnd=100) {
  res <- x[nStart:nEnd,] %>%
	as_tibble() %>%
	slice(which(row_number()%%2==1)) %>%
	rowSums()
  return (sum(res*runif(n=1, max=1.2)))
}
import numpy as np
def doStuff(x, nStart=1, nEnd=100):
x = x[nStart:nEnd,:];
x = x[range(0, nEnd, 2)]
x = x.sum(axis=1)
return (x*np.random.uniform(high=1.2, size=1)).sum()Which of the following operations will return a sum of all elements of matrix X with 100 rows?
A) doStuff(X)
B) doStuff(X, 1) + doStuff(X, 2)
C) If X is a matrix with 100 rows this function will generate error.
D) (doStuff(X, 1, 99) + doStuff(X, 2, 100)) / runif(1.2)
E) It is impossible to calculate the sum of all elements using this function.